Don’t you love learning? Wrestling with a concept, and finally putting the puzzle pieces together to see the bigger picture. That’s been me lately with this amorphous concept called the avoidance zone.
Well, longer than lately. It's been something I've wondered about since childhood, but I didn't know it was called that.
Growing up in west Tennessee I loved to go romping o'er hill and dale searching for wildflowers. But, finding any was rare. I can count on my hands and toes the number of really unique native wildflowers I found within a mile of my house (Erythronium albidum, Trillium recurvatum, and Phlox divaricata near the old creek; Arisaema triphyllum in the woods by the river; and on roadsides and in fencerows Tipularia discolor, Yucca flaccida, Vernonia gigantea, Podophyllum peltatum, Sedum pulchellum, Pycnanthemum tenuifolium, and Rudbeckia sp. along with a few other yellow Composite species I never keyed out. That’s pretty much it.
I felt so gypped. These books I read showed forest floors and prairies covered with a plethora of plants and blooms as far as the eye could see. Even traveling east towards Nashville you could see Trillium and Geranium going 70 mph on I-40. I lived in the country. Rural America. There should be ample flora for a budding young botanist.
Why weren’t there more wildflowers in west Tennessee? It wasn't that we couldn't grow plants. What flora was there grew very well. We had fertile soil, and we received abundant rainfall. I felt I should be finding more. Go east or west, and the number of different kinds increased. I assumed the reason why was because the region had been farmed to death. Fields and pastures now occupied my would-be floral dreamland.
But, had the species diversity been richer before conventional agriculture arrived on the scene? I wasn’t certain. Richer, of course, in a technical sense. Species richness is an evaluation of how many DIFFERENT types of species are present in an area.
Once in a conversation with one of my undergrad professors Dr. Nancy Baushaus, it arose that the same phenomenon is observed with mammals. The further you go east toward middle Tennessee or the Ozarks westward, the richness of mammals increases. This observation followed the same trend as what I saw with flora and made sense if we assume that the upper levels of the food pyramid are limited in their richness by the layers of species beneath them. The pyramids in Egypt don’t get wider as you climb.
* * *
A few years after I left home for grad school I became aware of the Biota of North America Program (BONAP), a great website for finding county-level distributions of plants species. With that data they help visualize what species occur where, and they can run analysis to see the richness of species diversity in different regions. Browsing the website I discovered this map...
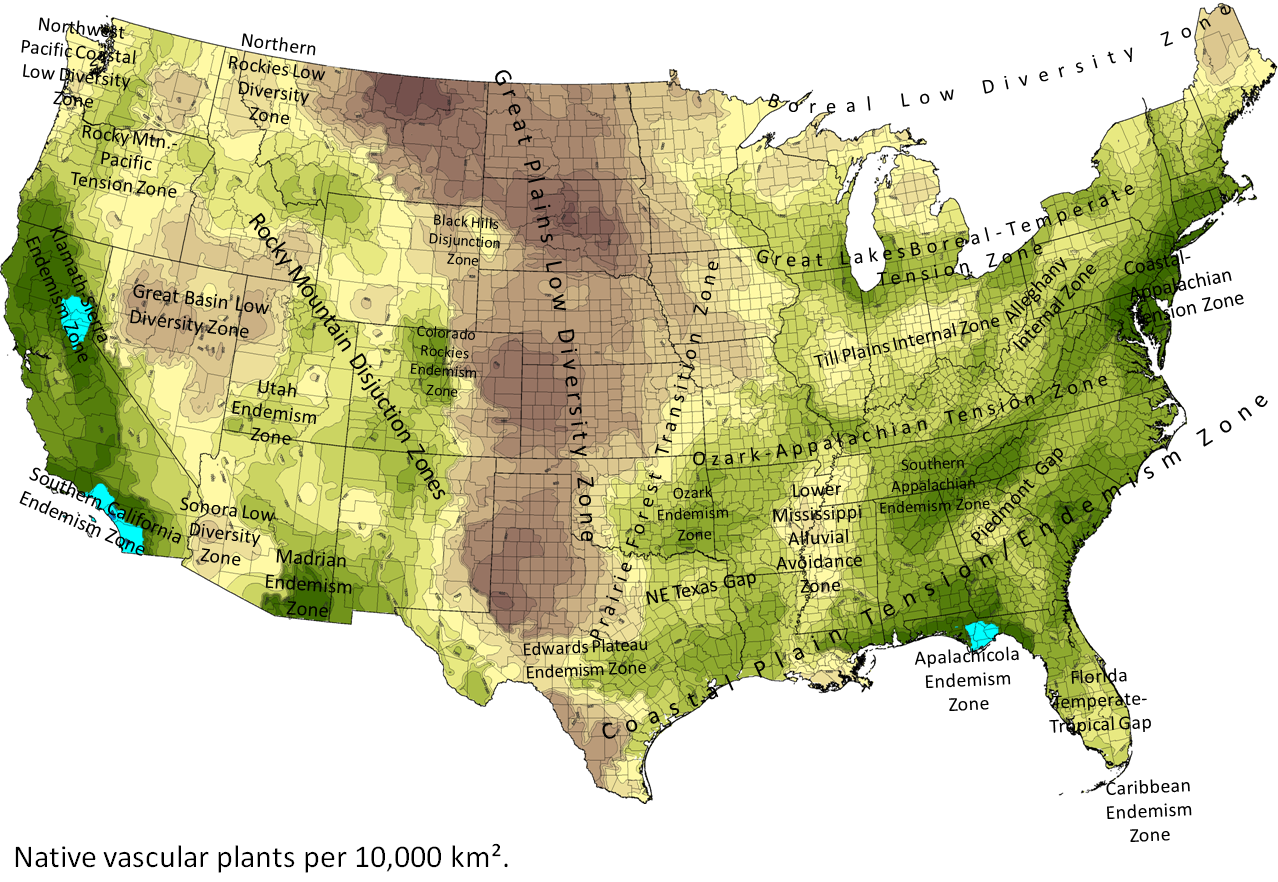
All credit to Biota of North America Program for generating this informative map. While a legend doesn't exist for the map, green has the highest number of plant species followed by lighter greens and yellow, followed by tans and browns for lowest diversity of native vascular plants. There is more information on the website about the terminology in the map.
...and that I had been living my childhood in a region called the… dun dun DUN... AVOIDANCE ZONE. It's like a little yellow desert island in a green sea of vegetation in the south. Maybe the dearth of wildflowers wasn't my imagination. Maybe there was something else going on here.
But, what? And, what is this thing called an avoidance zone? The BONAP website states it is where "flora [is] limited by [a] lack of suitable habitat for a diverse flora, whereby widespread species may have a range gap in this area rather than having its own flora.
The inner first grader in me came out yet again as I asked another why. Why a gap?!? There's plenty of resources in west Tennessee, especially with decent soils and ample rainfall. Years passed as this question sat on the back-burner in my mind, occasionally being stirred from a conversation here and there with a colleague.
Enter Thomas Rainer. He turned my mental stove up to high when he presented at Speaking of Gardening in Asheville this past August. Rainer said during his talk that stresses in a landscape actually increase plant diversity.
Wait, what?! Why would stress increase diversity? It seemed to go contrary to everything that I knew about organisms in their environment. If environments are too stressful, then hardly anything can grow well. (*Cough* Antarctica *Cough*)
Several Google searches later with keywords including species and stress and diversity yielded nothing. But, here is where things got interesting in my thinking. I flipped the increasing-stress-then-increasing-diversity hypothesis on its head and asked, "If stress increases diversity, could an absence of stress or low stress decrease diversity?" I.e. better conditions resulting in less types of plants growing in a region. Perhaps, but again I wanted to find hard evidence why.
* * *
A few weeks ago, I started reading Sowing Beauty by James Hitchmough. (Side note: I’m only a few pages into the book. It’s a great, great read if you want to learn more about how ecology can influence gardening.)
I found the answer!!!
James wrote that resource-rich environments have low species diversity because the competitor plants present outcompete other species (see my prior post to learn more about the three survival strategies of plants). That’s what they’ve evolved to do, to use resources more efficiently. And, with their resource-harnessing prowess, they tower over others and crowd them out.
Mind. Blown. I think competitor species created the avoidance zone. West Tennessee habitat is suitable, perhaps too suitable. I was amazed that it could be not directly due to resource availability or habitat suitability but an indirect effect from some species being resource hogs.
On a whim, I started looking at factors for plant growth across the country like soil fertility. The map below was created by Bradley Miller, Randall Schaetzl, and Frank Krist, Jr. (researchers at Michigan State University and United States Forest Service) to illustrate how productive soils are. Orange soils are less fertile, pink is in between, and purple/blue soils have the highest fertility.

All credit to Bradley Miller, Randall Schaetzl, and Frank Krist, Jr. for their incredible work creating this soil fertility index map. The link in the caption provides a more detailed legend, but again yellow/orange soils are least fertile, pink is in between, and purple/blue soils have the highest fertility.
To compare with the original BONAP map, I overlaid the two and created the nifty gif below.

Psychedelic, huh? While I haven’t done any statistical analysis, it appears that patterns exist between the two maps. As soil fertility increases (map gradients go from yellow/orange to pink to purple/blue), the species diversity decreases (map gradients go from green to yellow to brown). A few that popped out to me are listed below.
Orange on the soil fertility map corresponds with green/dark green in the Ozark Endemism Zone, Southern Appalachian Endemism Zone, Apalachicola Endemism Zone, and Coastal Appalachian Tension Zone.
Lower Mississippi Alluvial Avoidance Zone (aka home) is pinker in soil fertility than surrounding orange regions and has yellow/tan species diversity compared with the surrounding green/yellow green areas.
Great Plains Low Diversity Zone has a blue/purple color for soil fertility and tans and browns for species diversity (notice the orange spot in Nebraska where species diversity actually goes up a little)
Of course, soil fertility won't explain the entire interaction as there are other factors that influence plant growth, and not every part of the map follows the colors exactly. But, I can see patterns, and this observation helped me answer why we had low species diversity in west Tennessee.
* * *
The concept that at some point decreasing resource availability and increasing stress species has to result in a drop in diversity still bothered me. It is just logical, so how do we fit this thinking into a plant community model?
I was looking up some information recently on John Philip Grime who conceptualized the competitor, ruderal, and stress-tolerant model, and I came across his hump-back model of species diversity that really neatly wraps up much of what I've been mulling over since my childhood.

Figures from Michalet, R. and B. Touzard. 2010. Biotic interactions, biodiversity, and community productivity, p. 59–78. In: Francisco Pugnaire (ed.). Positive Plant Interactions and Community Dynamics. CRC Press, Boca Raton, FL.
Grime used data he collected from British plant communities to generate the above models. Curve B is of interest to this post. Again, species richness is an evaluation of how many DIFFERENT types of species are present in an area. As environmental stress increases, competitors can't grow as well; therefore, other species that can handle stress can survive. However, eventually the stress becomes so great that even the stress-tolerant species begin to decrease in number.
If you'd like to know about Curve A, it represents increasing management/disturbance. The more frequently plants are killed due to fire, flooding, etc. decreases the competitors so that other plants can grow; this stress increases diversity until the disturbance becomes so great that even the ruderal species decrease in number.
* * *
So, what’s the application of this? If I’m a common gardener, what do I care?
One is a repeat of what many have been writing—stress can be and is an asset in our gardens. We have a "more" mentality for the resources our plants need like water and fertilizer, but perhaps stressing things a bit would help us be successful with more species.
I also think understanding this hump-back model can make us better gardeners and designers in combining different species together. If we have a sense of what survival strategy a species uses, we can make sure that we aren't creating mini-avoidance zones in our gardens.
Finally, I don't think that the area I grew up in should be called the avoidance zone. I mean if you were a plant would you want to grow in an area called that? Kidding aside, yes, the region is a gap between higher species diversity areas, but I don’t think it accurately explains why. Plants were not avoiding west Tennessee. They were just being outcompeted.